How PostgreSQL Really Handles Connections
You spin up a new PostgreSQL database. Everything works great in dev. Then you hit production — five hundred users, a few slow queries, maybe a deploy that bounced the app — and suddenly Postgres is rejecting connections. The error log says:
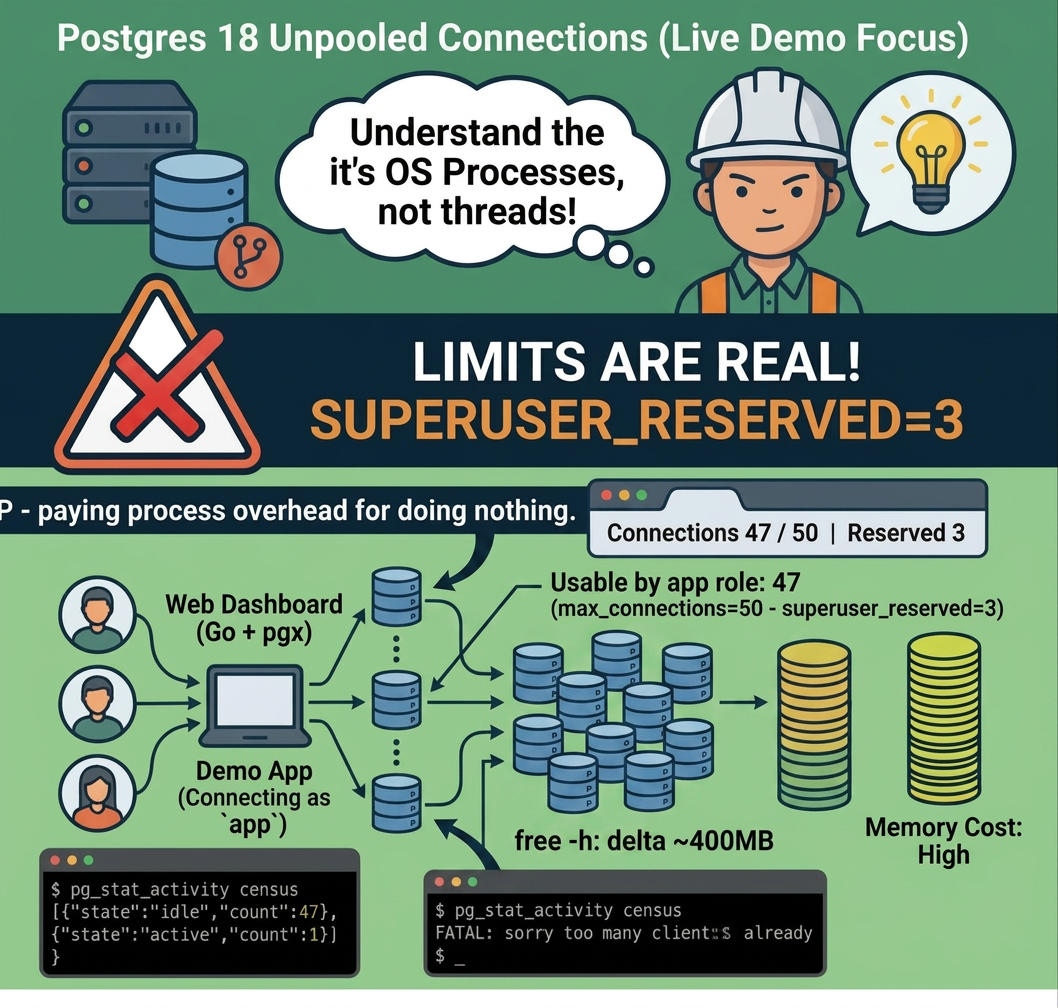
FATAL: sorry, too many clients already
If that's happened to you, or if you just want to make sure it never does, this post is for you.
The process-per-connection model
Every single client connection to PostgreSQL — every one — spawns a dedicated OS process. Not a thread. A process. The postmaster forks a new backend for each connection, and that process lives for the entire lifetime of the connection.
Here's the mental model: one main server process — the postmaster — listens on port 5432. Every connection request gets its own forked backend process with its own isolated memory space.
The upside is stability: if one backend crashes, the postmaster restarts it and the others are completely unaffected.
The downside is that every backend holds its own memory and CPU for the life of the connection — even when it's sitting idle, doing nothing. And that's what this whole series is about.
To prove it, I stood up a PostgreSQL 18 cluster on Kubernetes (CNPG) with max_connections = 50 and superuser_reserved_connections = 3, giving the application role 47 usable slots. I wrote a Go demo app using pgx with no pooling that connects directly and holds connections open.
Opening 3 connections and listing processes inside the pod:
kubectl exec -n pool-demo-v01 postgres-1 -- ps aux | grep postgres
Each connection has its own postgres process with its own PID. They're not sharing memory; each one has its own local memory, its own query context, its own everything.
The real memory cost
Each backend shows up to 10 MB of mapped memory, though the OS shares much of that — in practice you'll see around 2–5 MB of additional physical memory per connection.
Do the math: 200 connections × 10 MB = 2 GB of RAM, just to hold connections open. Most of them sitting idle, waiting for the next request from your app.
Here's what I measured. Memory inside the database pod before opening connections:
              total        used        free      shared  buff/cache   available
Mem:           3.7Gi       1.5Gi       140Mi        21Mi       2.4Gi       2.3Gi
After opening all 45 available slots and holding them idle:
              total        used        free      shared  buff/cache   available
Mem:           3.7Gi       1.9Gi       110Mi        24Mi       2.1Gi       2.2Gi
Used memory jumped by roughly 100 MB, and not one of those connections has run a real query yet. That's 47 backends times that 5-to-10 MB of process overhead.
Querying pg_stat_activity — Postgres's internal view of every connection — confirms the picture:
[
  {"state": "idle", "count": 46},
  {"state": "active", "count": 1}
]
46 idle connections doing nothing. In most production systems the overwhelming majority are idle at any given moment. You're paying OS-level process overhead for connections that are doing nothing.
I've seen production clusters with 1,000 connections where 700 are just sitting idle — consuming around 5 GB of memory on a 64 GB box. Five gigs might not sound like a lot compared to 64, but that's 5 GB doing absolutely nothing. Just parked connections burning RAM.
Hitting the wall
Now let's hit the wall. Firing a burst of 55 simultaneous connections — think a deploy restart where every pod comes up and opens its connections at once:
✓ Connection 1 open
✓ Connection 2 open
...
✓ Connection 47 open
✗ Connection 48: FATAL: sorry, too many clients already
✗ Connection 49: FATAL: sorry, too many clients already
...
✗ Connection 55: FATAL: sorry, too many clients already--- Results ---
Succeeded: 47
Failed:    8
The wall isn't at 50 — it's at 47. Those last 3 slots are superuser-reserved; the application role can't touch them. That's exactly why you don't connect your app as a superuser. A superuser could grab those slots, which means a runaway app would eat your emergency reserve and lock you out right when you need to get in.
From the application's perspective, this is just an unhandled error: if your service has no retry logic, the user gets a 500.
And this doesn't only happen when traffic spikes. It happens:
- During deploys when new pods come up before old ones drain
- In connection storms where every service reconnects at once
- When your app has a connection leak — you call
Connect()and never close it
Why raising max_connections isn't the answer
The obvious instinct is to just raise max_connections. And yes, you can do that. But it's not a solution — it's a band-aid that makes the underlying problem worse.
Remember that 2 GB of RAM for 200 idle connections? Bump max_connections to 500 and now you've got 5 GB of potential overhead. In Kubernetes that means you need a bigger node or your pod gets OOM-killed. You haven't solved the idle connection problem — you've just moved the wall further out.
There's also a shared memory implication. Postgres pre-allocates certain structures — like the lock table — based on max_connections at startup. Higher max_connections means more shared memory consumed even when no one is connected.
max_connections is a ceiling, not a solution.
What you actually need is a connection pooler. Something that sits between your application and Postgres, maintains a small pool of real database connections, and serves many application requests through those few connections. Your app thinks it has a direct connection. Postgres only sees the pooler.
Where this leaves you
So here's where we are: Postgres is process-per-connection by design. Each connection has real OS-level cost. At scale — or during deploy restarts and connection storms — you will hit max_connections and your application will get FATAL errors. Raising the limit just moves the problem.
A connection pooler is the lever that actually holds under a storm. Point your app at the pooler instead of directly at Postgres, size the pool to what your database can genuinely serve, and the FATAL wall stops being something you can hit by accident.
This post is a companion piece to the video version of the same content. The video includes a live demo with a Go dashboard hitting a real PostgreSQL 18 cluster on Kubernetes — if you want to watch the connection counter climb and see FATAL errors in real time, check it out.
Enjoyed this video? Subscribe to The Postgres Guy on YouTube for more.
Vacuum & Analyze — bi-weekly PostgreSQL internals, no spam.